Problem statement
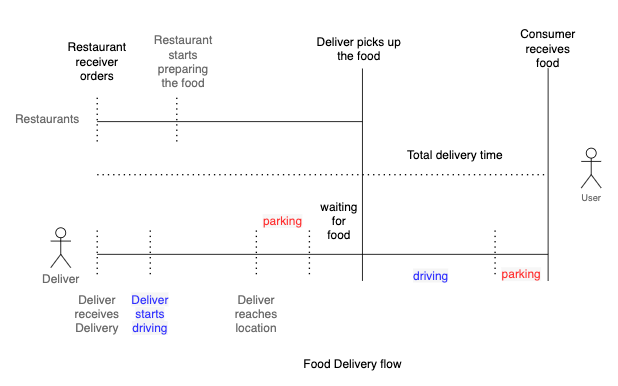
- Build a model to estimate the total delivery time given order details, market conditions, and traffic status.
- To keep it simple, we do not consider batching (group multiple orders at restaurants) in this exercise.
-
\[DeliveryTime=PickupTime+Point_to_PointTime+Drop_off_Time\]
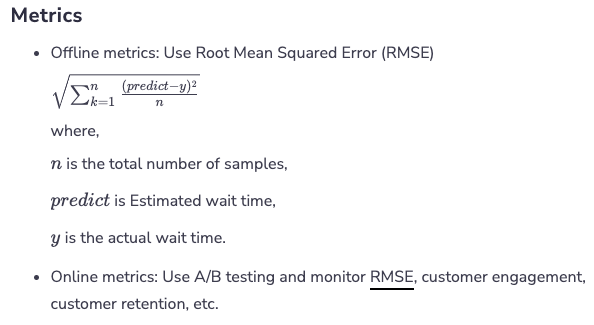
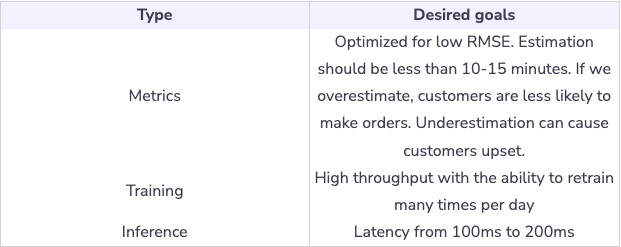
Metrics
Training
- During training, we need to handle a large amount of data. For this, the training pipeline should have a high throughput. To achieve this purpose, data can be organized in Parquet files
- The model should undergo retraining every few hours. Delivery operations are under a dynamic environment with a lot of external factors: traffic, weather conditions, etc. So, it is important for the model to learn and adapt to the new environment. For example, on game day, traffic conditions can get worse in certain areas. Without a retraining model, the current model will consistently underestimate delivery time. Schedulers are responsible for retraining models many times throughout the day.
- Balance between overestimation and under-estimation. To help with this, retrain multiple times per day to adapt to market dynamic and ##traffic conditions.
Inference
- For every delivery, the system needs to make real-time estimations as frequently as possible. For simplicity, we can assume we need to make 30 predictions per delivery.
- Near real-time update, any changes on status need to go through model scoring as fast as possible, i.e., the restaurant starts preparing meals, the driver starts driving to customers.
- Whenever there are changes in delivery, the model runs a new estimate and sends an update to the customer.
- Capture near real-time aggregated statistics, i.e., feature pipeline aggregates data from multiple sources (Kafka, database) to reduce latency.
- Latency from 100ms to 200ms
Estimated Delivery Model
- Learn how to build Estimate Delivery model for the food delivery app.
Feature Engineering
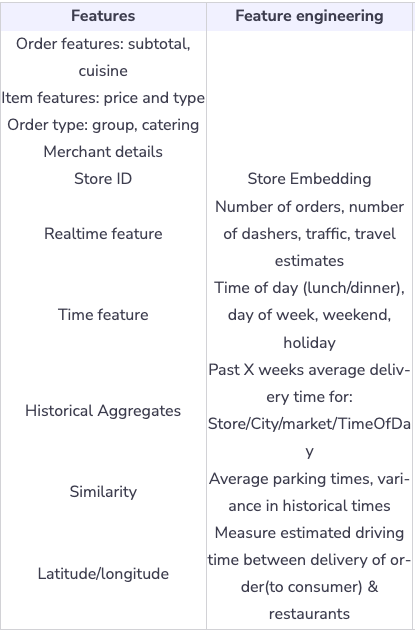
Training data
- We can use historical deliveries for the last 6 months as training data. Historical deliveries include delivery data and actual total delivery time, store data, order data, customers data, location, and parking data.
Model
- Gradient Boosted Decision Tree sample
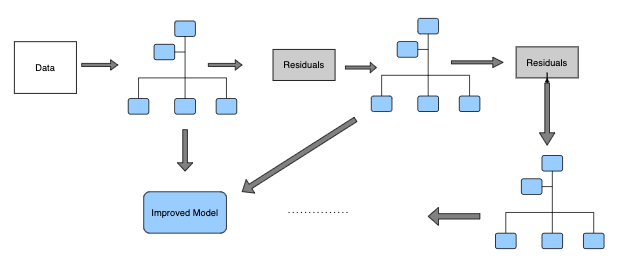
- How do Gradient Boosted Decision Trees work?
- Step 1: Given historical delivery, the model first calculates the average delivery time. This value will be used as a baseline.
- Step 2: The model measures the residual (error) between prediction and actual delivery time.
-
\[Error=ActualDeliveryTime−EstimatedDeliveryTime\]
- Step 3: Next, we build the decision tree to predict the residuals. In other words, every leaf will contain a prediction for residual values.
- Step 4: Next we predict using all the trees. The new predictions will be used to construct predictions for delivery time using this formula:
-
\[EstimatedDeliveryTime=Average_delivery_time+learning_rate∗residuals\]
- Step 5: Given the new estimated delivery time, the model then computes the new residuals. The new values will then be used to build new decision trees in step 3.
- Step 6: Repeat steps 3-5 until we reach the number of iterations that we defined in our hyperparameter.
- One problem with optimizing RMSE is that it penalizes similarly between under-estimate prediction and over-estimate prediction. Have a look at the table below. Note that both models use boosted decision trees.
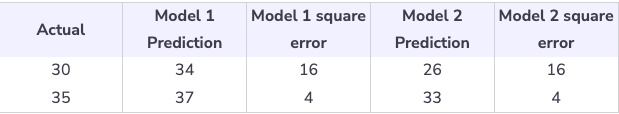
- Although Model 1 and Model 2 have the same RMSE error, model1 overestimates delivery time which prevents customers from making orders. Model2 underestimates the delivery time and might cause customers to be unhappy.
Estimate Food Delivery System Design
- Learn about the Estimate Food Delivery system design for the delivery app
Calculation & estimation
- Assumptions
- For the sake of simplicity, we can make these assumptions:
- There are 2 million monthly active users, a total of 20 million users, 300k restaurants, and 200k drivers deliver food.
- On average, there are 20 million deliveries per year.
- Data Size
- For 1 month, we collected data on 2 millions deliveries. Each delivery has around 500 bytes related features.
- Total size: \(500*2*10^6=10^9\)bytes = 1 Gigabytes
- Scale
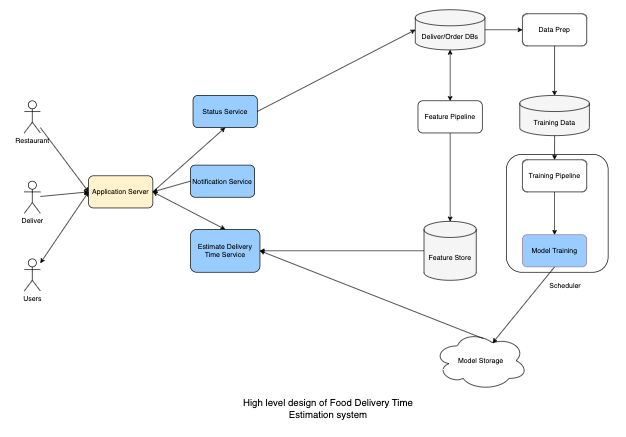
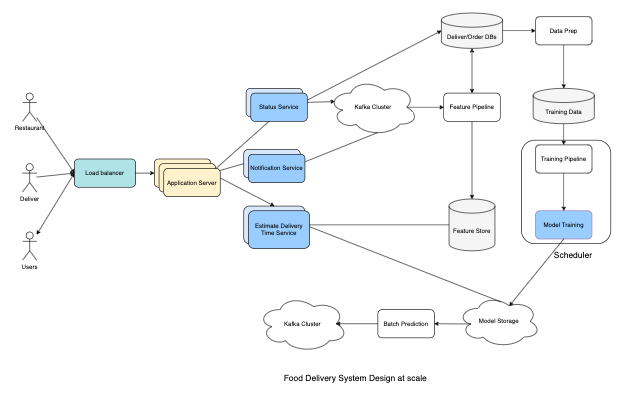
- Feature Store: Provides fast lookup for low latency. A feature store with any key-value storage with high availability like Amazon DynamoDB is a good choice.
- Feature pipeline: Reads from Kafka, transforms, and aggregates near real-time statistics. Then, it stores them in feature storage.
- Database: Delivery Order database stores historical Orders and Delivery. Data prep is a process to create training data from a database. We can store training data in cloud storage, for example, S3.
- We have three services: Status Service, Notification Service, and Estimate Delivery Time service. The first two services handle real-time updates and the Estimate Delivery Time service uses our Machine Learning Model to estimate delivery time.
- We have a scheduler that handles and coordinates retraining models multiple times per day. After training, we store the Model in Model Storage.
- There are three main types of users: Consumer/User, Deliver, and Restaurant.
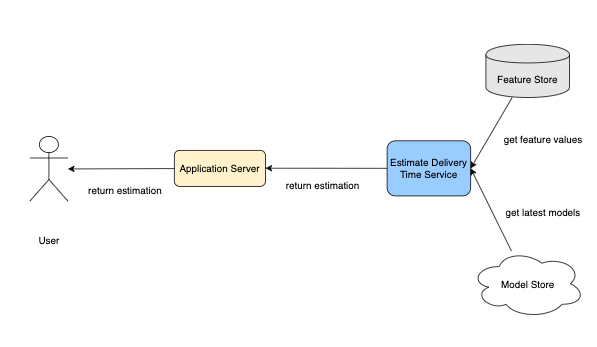
- User flow
- User visits a homepage, checks their food orders, and requests Application Server for an estimated delivery time.
- The Application Server sends the requests to the Estimate Delivery Time Service.
- The Estimate Delivery Time service loads the latest ML model from Model Storage and gets all the feature values from the Feature Store. It then uses the ML model to predict delivery time and return results to the Application Server.
- Restaurant/Deliver flow:
- When restaurants make progress, i.e., start making the dish or packaging the food, they send the status to Status Service.
- Status Service updates the order status. This event is usually updated in a queue service, i.e, Kafka, so other services can subscribe and get updates accordingly.
- Notification Service subscribed to the message queue, i.e., Kafka, and received the latest order status in near real-time.
Scale the design
- We scale out our services to handle large requests per second. We also use a Load Balancer to balance loads across Application Servers.
- We leverage streaming process systems like Kafka to handle notifications as well as model predictions. Once our Machine Learning model completes its predictions, it sends them to Kafka so other services can get notifications right away.