Distilled • Rental Search Ranking
- Problem statement
- Metrics
- Training
- Inference
- Booking Model
- Rental Search Ranking System Design
- Scale
Problem statement
- Airbnb users search for available homes at a particular location.
- The system should sort stays from multiple homes in the search result so that the most frequently booked homes appear on top.
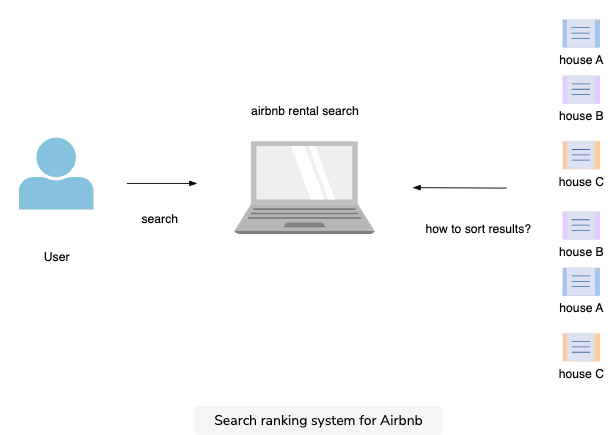
- The naive approach would be to craft a custom score ranking function. For example, a score based on text similarity given a query. This wouldn’t work well because similarity doesn’t guarantee a booking.
- The better approach would be to sort results based on the likelihood of booking. We can build a supervised ML model to predict booking likelihood. This is a binary classification model, i.e., classify booking and not-booking.
Metrics
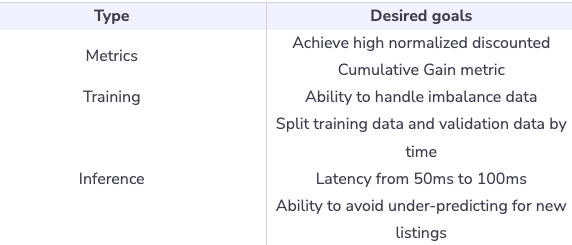
- Offline metrics:
- Discounted Cumulative Gain
- \[DCG_p=\sum_{i=1}^p \frac{rel_i}{\log_2(i+1)}\]
- where \(rel_i\) is relevance of result at position \(i\)
- Normalized discounted Cumulative Gain:
- IDCG is ideal discounted cumulative gain
- Discounted Cumulative Gain
- Online metrics
- Conversion rate and revenue lift: This measures the number of bookings per number of search results in a user session.
- \[Conversion_rate = (number_of_bookings)/(number_of_search_results)\]
Training
- Imbalanced data and clear-cut session: An average user might do extensive research before deciding on a booking. As a result, the number of non-booking labels has a higher magnitude than booking labels.
- Train/validation data split: Split data by time to mimic production traffic, for example, we can select one specific date to split training and validation data. We then select a few weeks of data before that date as training data and a few days of data after that date as validation data.
Inference
- Serving: Low latency (50ms - 100ms) for search ranking
- Under-predicting for new listings: Brand new listings might not have enough data for the model to estimate likelihood. As a result, the model might end up under-predicting for new listings.
Booking Model
- Learn about the booking model for the Airbnb Rental Search.
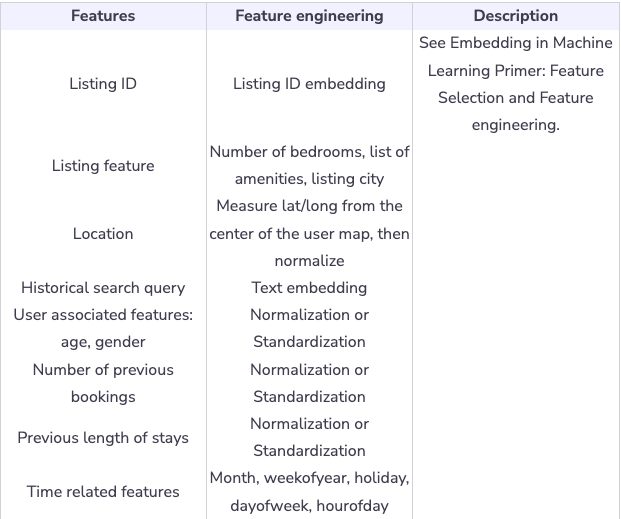
Feature engineering
- Geolocation of listing (latitude/longitude): Taking raw latitude and raw longitude features is very tough to model as feature distribution is not smooth. One way around this is to take a log of distance from the center of the map for latitude and longitude separately.
- Favourite place: store user’s favorite neighborhood place in 2 dimensions grid. For example, users add Pier 39 as their favorite place, we encode this place into a specific cell, then use embedding before training/serving.
Training data
- User search history, view history, and bookings. We can start by selecting a period of data: last month, last 6 months, etc., to find the balance between training time and model accuracy.
- In practice, we decide the length of training data by running multiple experiments. Each experiment will pick a certain time period to train data. We then compare model accuracy and training time across different experimentations.
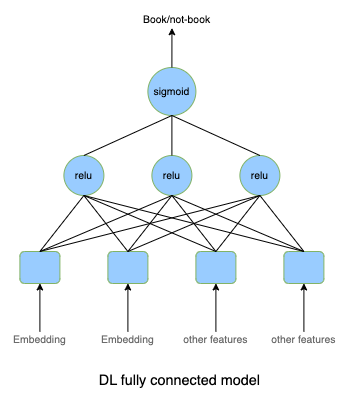
- Input: User data, search query, and Listing data.
- Output: This is a binary classification model, i.e., user books a rental or not.
- We can start with the deep learning with fully connected layers as a baseline. Model outputs a number within [0, 1] and presents the likelihood of booking.
- To further improve the model, we can also use other more modern network architecture, i.e., Variational AutoEncoder or Denoising AutoEncoder.
Rental Search Ranking System Design
- Learn about the rental search ranking system design for Airbnb.
Calculation & estimation
- Assumptions
- 100 million monthly active users
- On average, users book rental homes 5 times per year. Users see about 30 rentals from the search result before booking.
- 15 billion (\(5*30 * 10^8\)) observations/samples per year or 1.25 billion samples per month.
- Data size
- Assume there are hundreds of features per sample. For the sake of simplicity, each row takes 500 bytes to store.
- Total data size is \(500*1.25*10^9 bytes\) or 625 GB. To save costs, we can keep the last 6 months or 1 year of data in the data lake, and archive old data in cold storage.
- Scale
- Support 150 million users
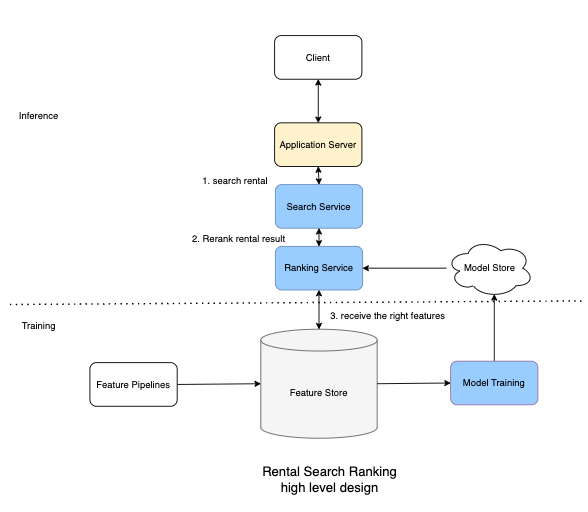
- Feature pipeline: Processes online features and stores features in key-value storage for low latency, down-stream processing.
- Feature store is a features values storage. During inference, we need low latency (<10ms) to access features before scoring. Examples of feature stores include MySQL Cluster, Redis, and DynamoDB.
- Model Store is a distributed storage, like S3, to store models.
- The user searches for rentals with given queries, i.e., city and time. The Application Server receives the query and sends a request to the Search Service.
- Search Service looks up in the indexing database and retrieves a list of rental candidates. It then sends those candidates list to the Ranking Service.
- Ranking service uses the Machine Learning model to score each candidate. The score represents how likely it is a user will book a specific rental. The Ranking service returns the list of candidates with their score.
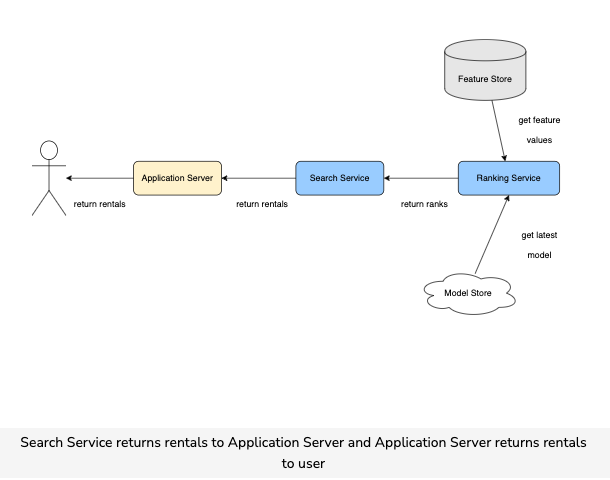
-
Search Service receives the candidates list with booking probability and uses the probability to sort the candidates. It then returns a list of candidates to the Application server, which, in turn, returns it to the users.
- As you can see, we started with a simple design, but this would not scale well for our demands, i.e., 150 million users and 1.25 billion searches per month. We will see how to scale the design in the next section.
Scale
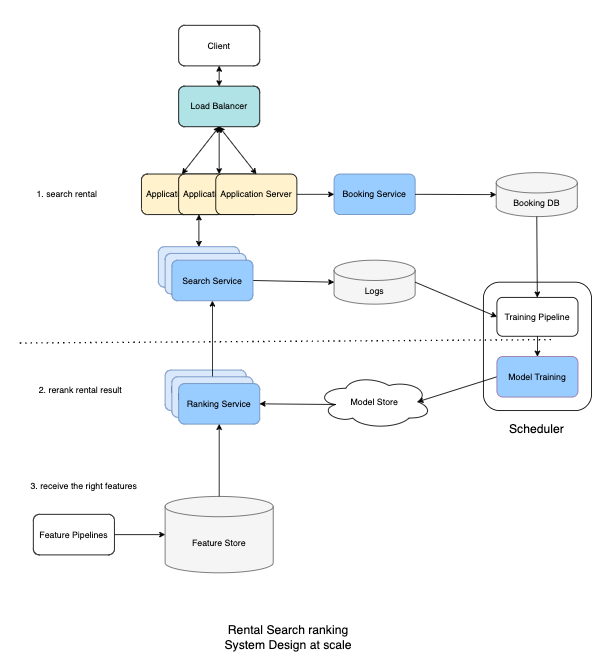
- To scale and serve millions of requests per second, we can start by scaling out Application Servers and use Load Balancers to distribute the load accordingly.
- We can also scale out Search Services and Ranking Services to handle millions of requests from the Application Server.
- Finally, we need to log all candidates that we recommended as training data, so the Search Service needs to send logs to a cloud storage or send a message to a Kafka cluster.
- We learned to formulate search ranking as a Machine Learning problem by using booking likelihood as a target.
- We learned to use Discounted Cumulative Gain as one metric to train a model.
- We also learned how to scale our system to handle millions of requests per second.