Primers • SciPy Tutorial
SciPy
- NumPy provides a high-performance multidimensional array and basic tools to compute with and manipulate these arrays.
- SciPy builds on this, and provides a large number of functions that operate on NumPy arrays and are useful for different types of scientific and engineering applications.
- Some useful parts of SciPy are highlighted below.
Image operations
- SciPy provides some basic functions to work with images.
- For example, it has functions to read images from disk into NumPy arrays, to write NumPy arrays to disk as images, and to resize images.
- Here is a simple example that showcases these functions:
from scipy.misc import imread, imsave, imresize
import numpy as np
import matplotlib.pyplot as plt

# Read an JPEG image into a numpy array
img = imread('cat.jpg')
print(img.dtype, img.shape)  # Prints "uint8 (400, 248, 3)"

# We can tint the image by scaling each of the color channels
# by a different scalar constant. The image has shape (400, 248, 3);
# we multiply it by the array [1, 0.95, 0.9] of shape (3,);
# numpy broadcasting means that this leaves the red channel unchanged,
# and multiplies the green and blue channels by 0.95 and 0.9
# respectively.
img_tinted = img * [1, 0.95, 0.9]

# Resize the tinted image to be 300 by 300 pixels.
img_tinted_resized = imresize(img_tinted, (300, 300))

# Show the original image
plt.subplot(1, 2, 1)
plt.imshow(img)

# Show the tinted image
plt.subplot(1, 2, 2)

# A slight gotcha with imshow is that it might give strange results
# if presented with data that is not uint8. To work around this, we
# explicitly cast the image to uint8 before displaying it.
plt.imshow(np.uint8(img_tinted_resized))
plt.show()

# Write the tinted image back to disk
imsave('cat_tinted_resized.jpg', img_tinted_resized)
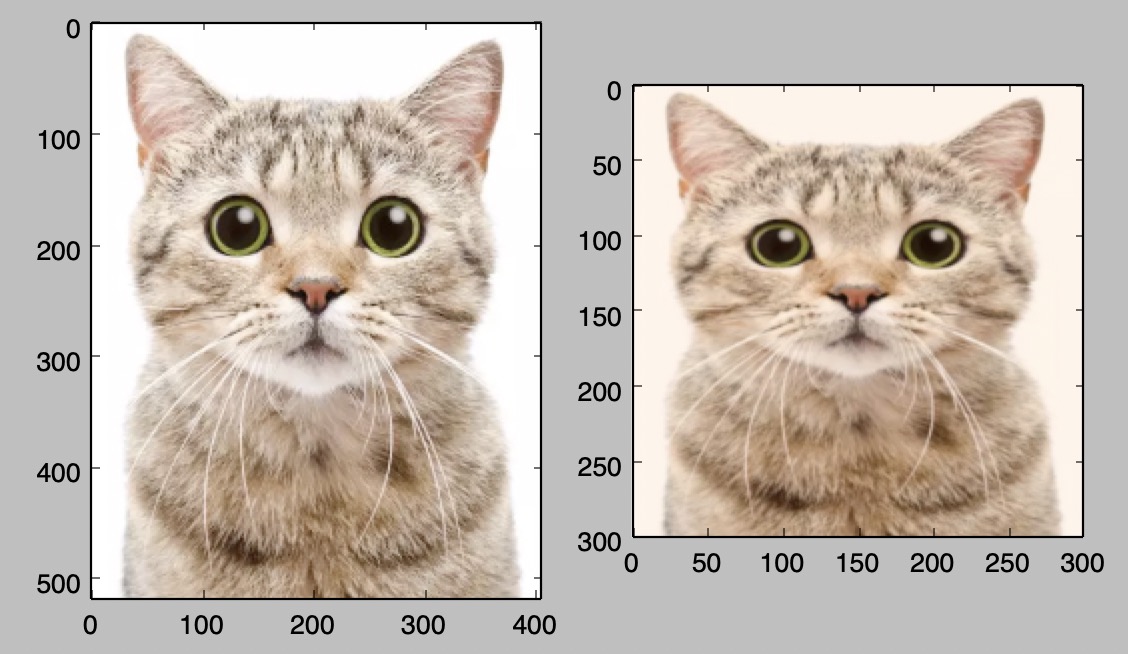
- On the left, you see the original image, while on the right is the tinted and resized image.
MATLAB files
- The functions
scipy.io.loadmat()andscipy.io.savemat()allow you to read and write MATLAB files. - You can read about them in the SciPy documentation.
Distance between points
- SciPy defines some useful functions for computing distances between sets of points.
- The function
scipy.spatial.distance.pdist()computes the distance between all pairs of points in a given set:
import numpy as np
from scipy.spatial.distance import pdist, squareform

# Define the following array where each row is a point in 2D space:
# [[0 1]
#  [1 0]
#  [2 0]]
x = np.array([[0, 1], [1, 0], [2, 0]])
print(x)

# Compute the Euclidean distance between all rows of x.
# d[i, j] is the Euclidean distance between x[i, :] and x[j, :],
# and d is the following array:
# [[ 0.          1.41421356  2.23606798]
#  [ 1.41421356  0.          1.        ]
#  [ 2.23606798  1.          0.        ]]
d = squareform(pdist(x, 'euclidean'))
print(d)
-
For details about this function, refer to the SciPy documentation.
-
A similar function (
scipy.spatial.distance.cdist) computes the distance between all pairs across two sets of points; you can read about it in the SciPy documentation.
References
- Parts of this tutorial were originally contributed by Justin Johnson.
- Stanford CS231n Python/Numpy Tutorial served as a major inspiration for this tutorial.
- SciPy documentation.