Primers • Gantt Charts
- Overview
- History
- What Gantt Charts Track
- Features and Benefits
- How Gantt Charts Work
- Applications
- Advantages
- Potential Challenges and Solutions
- Tools for Creating Gantt Charts
- References
- Citation
Overview
- Gantt charts are an essential tool in project management, particularly for roadmapping cross-functional projects involving multiple teams or departments. They provide a clear and visual roadmap of tasks, timelines, and dependencies, enabling effective coordination and communication among diverse stakeholders.
- Most commonly used for tracking project schedules, Gantt charts allow teams to monitor timelines, task progress, and resource allocation. Whether used in traditional or Agile project environments, Gantt charts offer a high-level overview that is indispensable for aligning teams and tracking progress.
- The visual clarity of Gantt charts supports detailed planning and tracking, facilitating better communication and coordination. While they come with challenges, their benefits—such as improved organization and accountability—make them indispensable for managing complex projects. By integrating Gantt charts with other methodologies and tools, teams can enhance their effectiveness and deliver successful outcomes.
History
- The first Gantt chart was created in the mid-1890s by Karol Adamiecki, a Polish engineer who developed it to optimize workflows in industrial settings. However, Adamiecki’s work remained largely unknown outside of Eastern Europe.
- About 15 years later, Henry Gantt, an American engineer and consultant, independently devised a similar chart, which gained widespread popularity in Western countries. Consequently, Gantt’s name became synonymous with this project management tool.
- Initially, Gantt charts were drawn manually, requiring significant effort to update with project changes. This limitation made them less practical for dynamic projects. With the advent of computers and project management software, Gantt charts became far more efficient and adaptable. Modern tools allow for quick updates, automated dependencies, and the inclusion of additional information such as resource usage and task progress, making them indispensable in contemporary project management.
- By evolving from manual drafts to dynamic, software-driven tools, Gantt charts have become integral to managing complex, multi-faceted projects across industries.
What Gantt Charts Track
-
Gantt charts track various aspects of a project, offering a holistic view of its status and structure. The main elements tracked in a Gantt chart include:
-
Activities (Tasks or Events):
Each task is represented by a bar on the chart, with its length and position indicating the start date, duration, and end date. -
Time Scale:
The timeline, displayed along the top, defines the project’s schedule. It can range from days to months, depending on the project’s scope. -
Task Dependencies:
Relationships between tasks (e.g., one task starting only after another finishes) are visually represented, helping to manage sequential or parallel workflows. -
Milestones:
Significant events or deliverables are marked as milestones, providing key checkpoints for the project. -
Progress Tracking:
Real-time updates, such as percentage completion, allow stakeholders to monitor progress and address delays proactively. -
Resource Allocation:
Some Gantt charts include information about resource usage, such as which team or individual is assigned to a specific task.
-
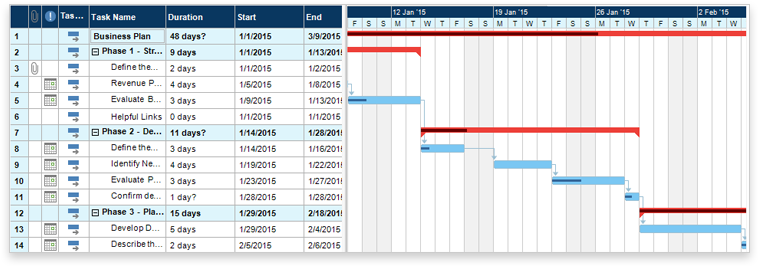
Example
- The following figure (source) illustrates a simple Gantt chart which shows what has to be done (the activities) and when (the schedule/milestones).
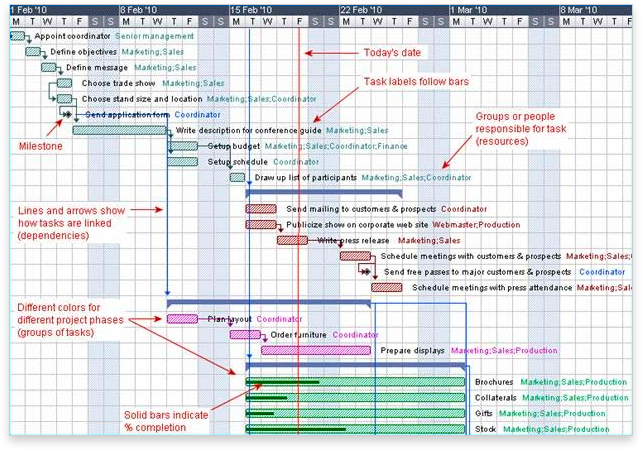
- The following figure (source) illustrates an advanced Gantt chart with additional information used for tracking the project’s schedules, tasks, and phases, such as how the tasks relate to each other in terms of dependencies, how far each task has progressed, what resources are being used for each task and so on.
Features and Benefits
Visualization of Project Schedule
- Gantt charts make complex project timelines easy to understand by visually representing:
- What needs to be done (tasks/activities).
- When each task starts and ends.
- How tasks overlap or depend on one another.
Task Ownership
- Tasks can be assigned to specific individuals or teams, ensuring accountability and clarity in cross-functional settings.
Dependencies and Relationships
- By showing dependencies, Gantt charts prevent misunderstandings about task sequencing and highlight potential bottlenecks.
Progress Tracking
- Gantt charts allow teams to visualize:
- Percentage completion of tasks.
- Delays or risks in meeting deadlines.
Scalability and Flexibility
- Gantt charts are effective for projects of all sizes, from simple task lists to complex, multi-team initiatives.
How Gantt Charts Work
Bar Representation
- Each task or activity is displayed as a horizontal bar. The length of the bar corresponds to the task’s duration, while its position reflects the start and end dates.
Milestones
- Milestones are marked as special points on the chart to signify key events or the completion of critical deliverables.
Dependencies
- Dependencies are shown as arrows connecting tasks, indicating relationships such as:
- Finish-to-Start (Task B begins only after Task A ends).
- Start-to-Start (Tasks A and B start simultaneously).
Time Scale
- The time scale is customizable to suit project needs, ranging from hours for short-term projects to months for long-term initiatives.
Applications
Coordination Across Teams
- Gantt charts centralize project information, making it accessible to all stakeholders. This ensures everyone has a shared understanding of timelines and deliverables.
Aligning Goals and Deliverables
- By clearly defining tasks and deadlines, Gantt charts help cross-functional teams align their efforts toward common goals.
Risk Management
- Highlighting task dependencies and resource usage allows project managers to anticipate and mitigate risks.
Communication Tool
- Gantt charts serve as a powerful communication tool, providing updates to stakeholders with a visual summary of the project.
Advantages
- Improved Visibility: Teams can see the entire project timeline, including who is responsible for what and when tasks are due.
- Enhanced Collaboration: Clear task ownership and dependencies encourage collaboration and accountability.
- Real-Time Tracking: Progress indicators help teams stay on track and adapt to changes as needed.
- Structured Planning: Gantt charts offer a disciplined approach to planning, ensuring that all aspects of the project are considered.
- Facilitates Reporting: Project managers can easily generate progress reports by referencing the Gantt chart.
Potential Challenges and Solutions
Complexity in Large Projects
- Challenge: Gantt charts can become cluttered when managing extensive projects.
- Solution: Use project management tools that support filtering, zooming, and collapsing task groups.
Time-Intensive to Maintain
- Challenge: Updating a Gantt chart can be time-consuming in dynamic environments.
- Solution: Automate updates through integrated project management software (e.g., Microsoft Project, Jira).
Overemphasis on Timelines
- Challenge: Gantt charts may focus too heavily on schedules, overlooking other aspects like team dynamics.
- Solution: Combine Gantt charts with other tools (e.g., Agile boards) for a holistic approach.
Tools for Creating Gantt Charts
- Popular tools for creating and managing Gantt charts include:
- Jira: Offers Gantt chart plugins for Agile teams.
- Asana: Includes timeline features ideal for cross-functional collaboration.
- Microsoft Project: A comprehensive project management tool.
- Smartsheet: Combines spreadsheets with Gantt chart capabilities for detailed planning.
References
Citation
If you found our work useful, please cite it as:
@article{Chadha2020DistilledGanttCharts,
  title   = {Gantt Charts},
  author  = {Chadha, Aman and Jain, Vinija},
  journal = {Distilled AI},
  year    = {2020},
  note    = {\url{https://vinija.ai}}
}