CS230 • AI in Healthcare and a Case Study of Cell Segmentation
- In this topic, firstly we will present some applications of AI in Healthcare and then, we will go over a case study: Cell Segmentation. Here is the outline:
AI in Healthcare
Healthcare problems of interest
- Descriptive (what happened?): e.g, What was a patient’s heart rate through their day.
- Diagnostic (why did it happen?): e.g: Why is this patient coughing for 2 weeks? Does their chest-xray show signs of pneumonia?
- Predictive (what will happen?): e.g: Will this patient develop heart failure as a result of chemotherapy?
-
Prescriptive (what should we do?): e.g: Should this diabetic patient be treated with metformin or through changes in lifestyle?
- These problems become more and more complex from top to bottom. Therefore, we need to take into account more things and so, more data.
Paradigm Shift of Deep Learning
- One already happened and the other one is coming. In 2013-2014, there was an important paradigm shift from Feature Engineering + Machine Learning to End-to-End Deep Learning pipelines. The next paradigm shift will suppress the human as the designer of the deep learning architecture.
On-going Research in the Stanford ML Group
1D example: Detecting Arrhythmias with CNNs
- Arrhythmias cost 12.8 billion dollars in the US. Current diagnostic tools are: ECGs, Holter Monitor and Patches. A patch records in 2 weeks 1.4 million heart beats with only a couple of electrodes. Therefore, the signal quality is not optimal. On the other hand, the interpretation of this large amount of data would take a long time for a doctor to analyze. Therefore, there is a need to automatize the ECG analysis.
- Proposed architecture to detect 1D patterns in Arrhythmias: 34 layers CNN with residual blocks to stabilize training of this deep Neural Network.
- Dataset was collected on patients wearing continuous ECG monitoring devices (~32k minutes, 29k patients, 600x bigger than open-source dataset MIT-BIH) and labelled by clinical ECG experts. The test set was more precisely labelled with a committee of cardiologists.
- Interesting results: The model outperforms the human in terms of the F1 score and makes less dangerous mistakes.
- The project website can be found here.
2D example: Detection of Pneumonia on Chest X-Rays
-
Pneumonia causes 1 million hospitalizations and 50k deaths per year in the US alone. Appearance of pneumonia in X-ray images is often vague, and can mimic other abnormalities. If not pus filling alveoli, but:
- Cells (Cancer)
- Blood (Pulmonary Hemorrhage)
- Fluid (Edema)
The setup to detect Pneumonia is the following one:
- The input is a frontal-view chest X-ray image and the output is a binary label \(t \in {0,1}\) indicating the absence or presence of pneumonia.
- The model is a CNN over 224x224 images, pretrained on ImageNet with a 121 layer DenseNet architecture.
- Test set of 420 samples, annotated by 4 Stanford radiologists. The F1-score is calculated by using each of the 4 radiologists as the ground truth independently.
This research project focused on the interpretability problem as well. Would it be reasonable to trust the model to make decisions? To help answer this question, class activation maps are provided for each prediction. Class activation maps allow the doctor to see where the model is particularly looking at to make its decision. The project website can be found here.
3D example: AI-assisted diagnosis for knee MR
MR of the knee is the standard of care modality to evaluate knee disorders. The prediction task is characterized by the following features:
- Multi-Label problem: A training example consists in 3 groups of 3 images each and the output is the probability of three different medical conditions: Abnormality, ACL or Meniscus Disorder.
- Size of training set: 1370 knee MR exams. The validation set has 120 knee MR exams labelled by a team of 3 musculoskeletal radiologists.
- The model combines 9 ConvNets with AlexNet architecture and then uses a regression algorithm to output the final probabilities.
The project website can be found here.
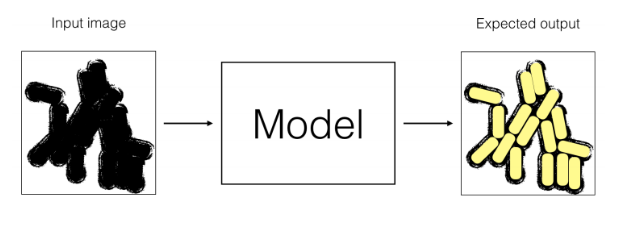
Case Study: Cell Segmentation
Goal: Determine which parts of a microscopic image correspond to which individual cells.
Data: Doctors have collected 100,000 images from microscopes and gave them to you. Images have been taken from three types of microscopes.

Data
-
Question: The doctors who hired you would like to use your algorithm on images from microscope C. How would you split this dataset into train, dev, and test sets?
- Answer:
- Based on the size of our dataset, a 90/5/5 percentage-wise split would work for our classification task.
- Distribution of test and dev set should be the same. Since the algorithm is going to be used for classification on images from microscope type C, our test and dev split should contain only images of this type.
- To improve performance, model needs to observe test data during training. Thus, there should be type C images in train split as well.
-
Question: Can you augment this dataset? If yes, give only 3 distinct methods you would use. If no, explain why (give only 2 reasons).
- Answer: Many augmentation techniques would work in this case:
- cropping
- adding random noise
- changing contrast, blurring
- flip
- rotate
Architecture and Loss
- Question:
- What is the mathematical relation between nx and ny?
- What should be the last activation function of your network?
- What loss function should you use?
- Answer:
- nx = 3 x ny
- Sigmoid activation
- Summation over all pixel value with cross entropy loss
Transfer Learning
- Let’s assume that you have coded your neural network (Model M1), and have trained it for 1,000 epochs. But it does not perform well.
-
One of your friends suggests to use trasnfer learning using another labeled dataset made of 1,000,000 microscope images for skin disease classification (very similar images).
-
A model (M2) has been trained on this dataset for a 10-class classification task. Here is an example of input/output of model M2.
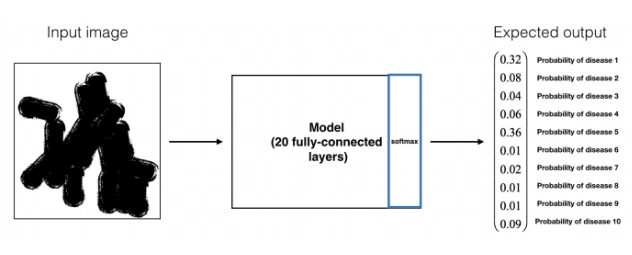
-
Question: Performing transfer learning from M2 to M1, what are the new hyperparameters that you will have to tune?
- Answer: number of layers to be kept from the pretrained model, number of layers to be added, number of layers to be freezed. Note that after freezing parts of the pretrained network, rest of the layers will be trained on our dataset; pretrained weights will be used as initial weights for pretrained model’s layers, while new layers will be initialized randomly.
Network Modification
- Your model achieves a good performance; however, looking at your outputs, you realize that the boundaries between cells are not as clear as doctors want them to be. Since they want the model to help with cell identification, boundaries need to be clear.
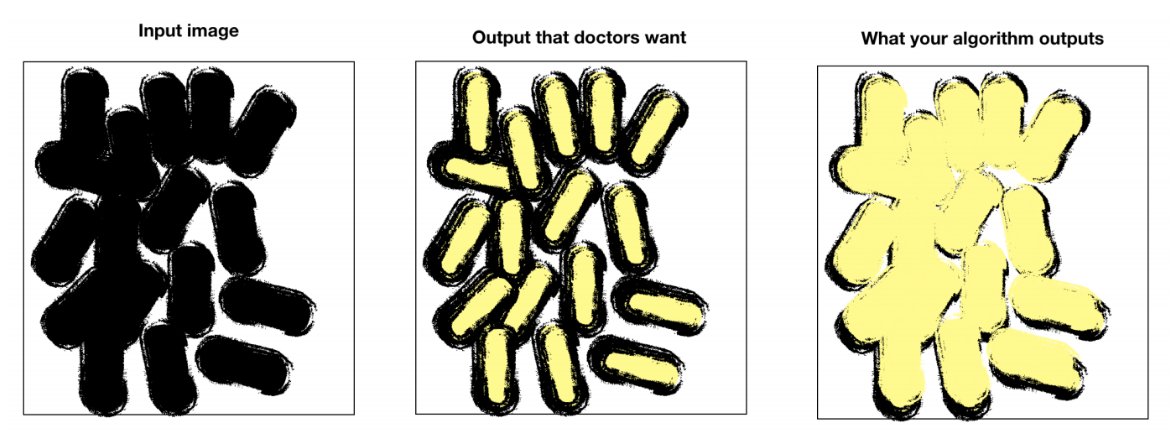
-
Question: How can you correct your model and/or dataset to satisfy the doctors’ request?
-
Answer: Modify the dataset in order to label the boundaries between cells. In addition to the two labels associated with ‘cell’ or ‘not cell,’ there will be a third label classifying boundaries. On top of that, change the loss function to give more weight to boundaries or penalize false positives.
-
New Goal: You are given a dataset containing images similar to the previous ones. The difference is that each image is now labeled as 0 (there are no cancer cells on the image) or 1 (there are cancer cells on the image). You easily build a state-of-the-art model to classify these images with 99% accuracy. The doctors are astonished and surprised, they ask you to explain your network’s predictions.
-
-
Question: Given an image classified as 1 (cancer present), how can you figure out based on which cell(s) the model predicted 1?
- Answer: Gradient of the output with respect to input X. The computed matrix will capture output’s sensitivity to changes in different pixels of input.
-
Question: Your model detects cancer on cells (test set) images with 99% accuracy, while a doctor would on average perform 97% accuracy on the same task. Is this possible? Explain.
- Answer: If the dataset was entirely labeled by this one doctor with 97% accuracy, it is unlikely that the model can perform at 99% accuracy. However if annotated by multiple doctors, the network will learn from these several doctors and be able to outperform the one doctor with 97% accuracy. In this case, a panel composed of the doctors who labeled the data would likely perform at 99% accuracy or higher.
-
New New Goal: To solve your binary classification (presence/absence of cancer cell(s)), you decided to implement the following pipeline.
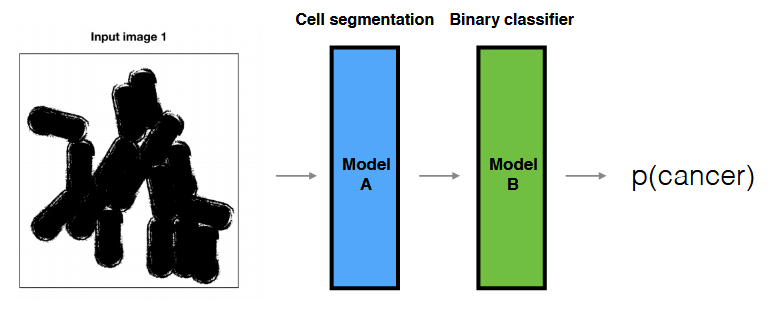
- Question:
- What are the advantages/disadvantages of this model compared to the previous end-to-end binary classifier?
- If your model doesn’t perform well, how can you find what the problem is?
- Answer:
- Advantages: requires less data in general by leveraging human crafted knowledge; still works if labelled data is not present in both ends.
- Disadvantages: might limit the model’s potential performance if the hand-engineered components aren’t optimal.
- Isolating the modules and evaluating their performance individually.